You post consistently. You're getting likes. But is your content actually working? Follower count tells you the size of your audience. Engagement rate tells you whether that audience is paying attention. It's the metric that separates "posting on LinkedIn" from "growing on LinkedIn."
If you've never calculated yours, or you're not sure whether your number is good, bad, or average, this guide breaks it all down: the formula, the different ways to calculate it, 2026 benchmarks, and how to read your own results.
What Is LinkedIn Engagement Rate?
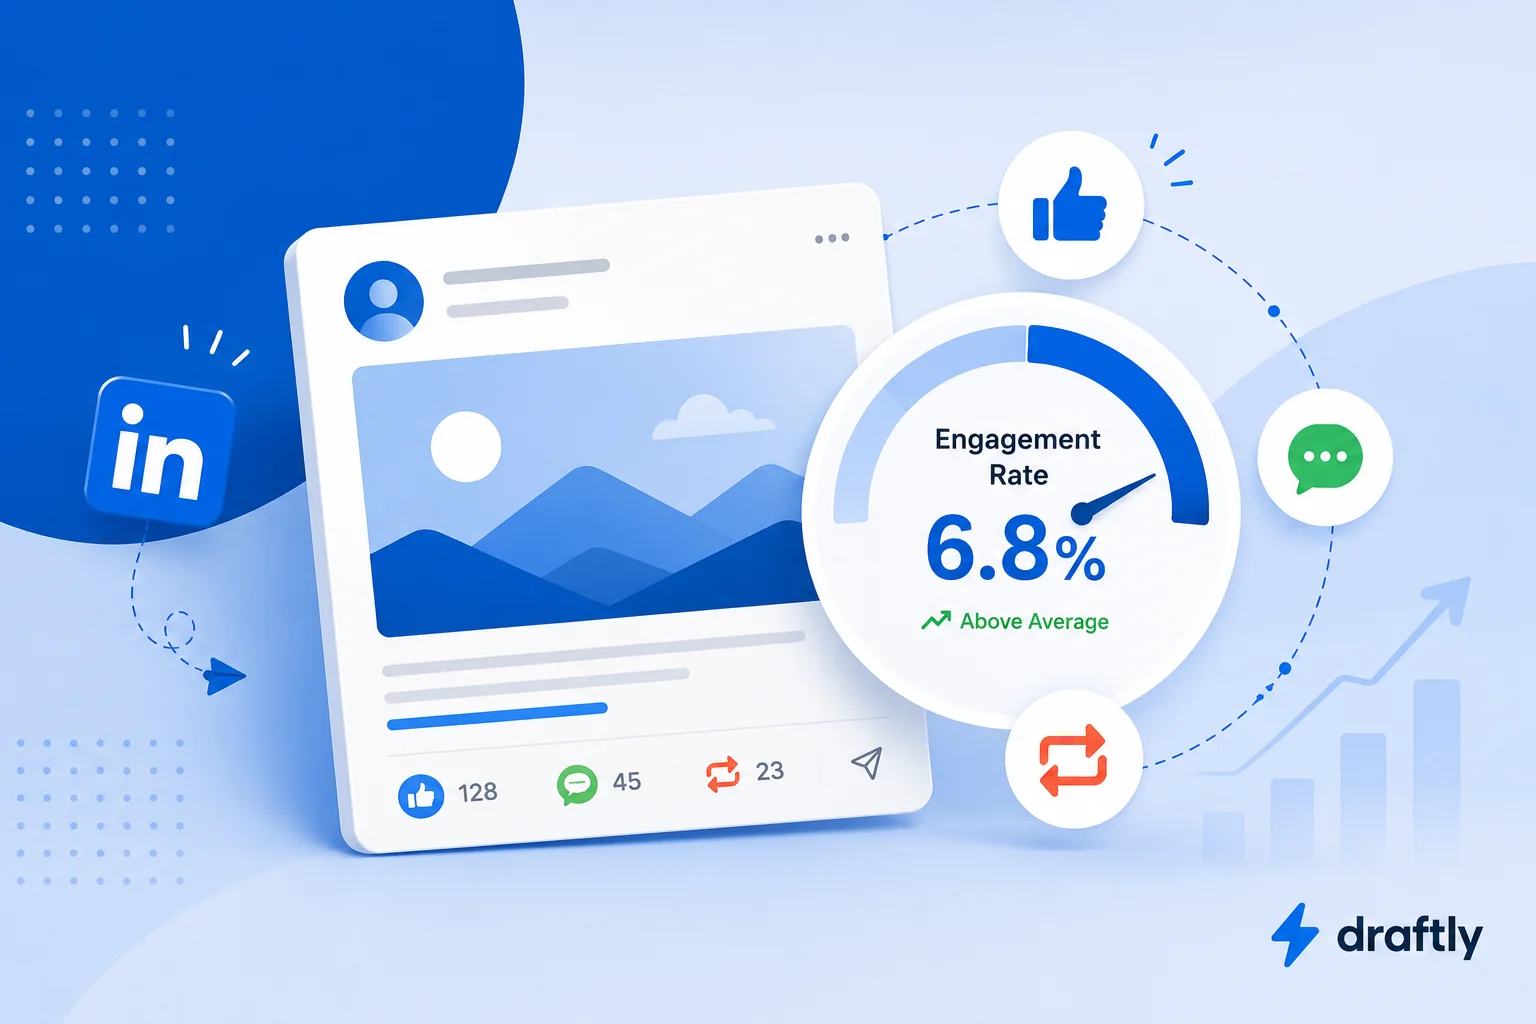
Your LinkedIn engagement rate is the percentage of people who interacted with your content out of the total number of people who saw it. "Interacted" typically means reactions, comments, reposts, and clicks.
It matters more than raw like counts because it's relative. A post with 500 likes from an account with 2 million followers is actually underperforming. A post with 50 likes from an account with 3,000 connections is crushing it. Engagement rate levels the playing field so you're comparing performance, not audience size.
The 3 Ways to Calculate Engagement Rate
Most people assume there's one formula. There are actually three, and they don't produce the same number.
By impressions: Engagement Rate = (Reactions + Comments + Reposts) ÷ Impressions × 100
By followers: Engagement Rate = (Reactions + Comments + Reposts) ÷ Total Followers × 100
By reach (unique viewers): Engagement Rate = (Reactions + Comments + Reposts) ÷ Unique Viewers × 100
Calculating by followers is the simplest since that number is always visible on your profile, but it's the least accurate. Not every follower sees every post, so this method can wildly overstate or understate performance depending on how well your content is distributed that week.
Calculating by impressions is the industry standard and the one most analytics tools default to, because impressions measure who actually had the chance to engage, not just who follows you.
Here's what the impressions-based formula looks like in practice:
A post gets 8,400 impressions, 210 reactions, 34 comments, and 12 reposts. (210 + 34 + 12) ÷ 8,400 × 100 = 3.02% engagement rate
You can find both numbers, impressions and total interactions, directly in LinkedIn's native post analytics, which sit right under each post you publish. Tracking your LinkedIn impressions alongside engagement gives you the full picture of how far your content is traveling, not just how well it's landing once it arrives.
What's a Good LinkedIn Engagement Rate in 2026?
This is the part where "it depends" is actually the honest answer. Different tracking studies report different averages, and the gap between them is wide. Here's how to read the range:
- Company pages: most 2026 benchmark studies put the average somewhere between 2% and 5%, with larger, more established pages typically landing on the lower end.
- Personal profiles: these tend to outperform company pages, often landing in the 3% to 6%+ range, since personal posts benefit from direct, authentic network connections.
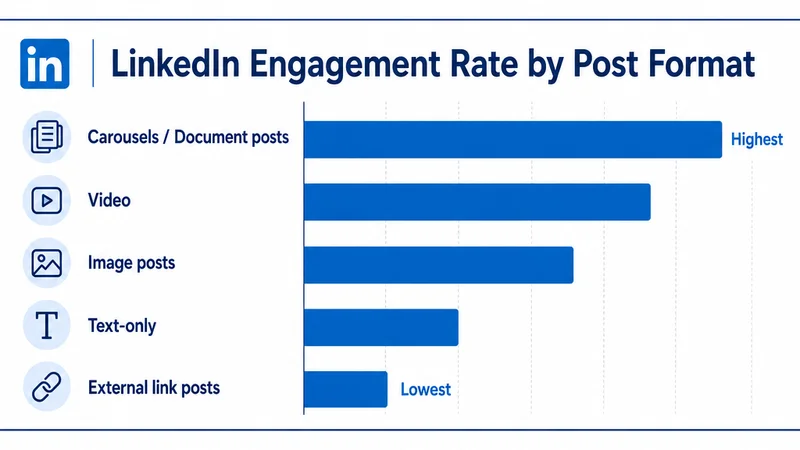
- Format matters a lot: across nearly every study, carousels and native document posts (PDF-style slide uploads) consistently post the highest engagement rates, often several times higher than plain text updates, because they hold attention longer.
- Smaller accounts often win: creators with a few thousand connections regularly out-engage accounts with hundreds of thousands of followers, simply because their audience is more tightly connected to them.
The takeaway: don't chase a single "magic number" from one study. Track your own baseline first, then aim to beat your average, and compare yourself against similarly sized accounts in your industry rather than the platform as a whole. Keep in mind that a great number is only worth as much as what fed it: a solid rotation of LinkedIn post ideas matters just as much as the format you post them in.
Why Smaller Accounts Often Have Higher Engagement Rates
If you're comparing your numbers to a creator with 200,000 followers and feeling discouraged, stop. Engagement rate almost always falls as follower count rises, and it's not because bigger accounts are doing anything wrong.
A creator with 3,000 close connections is posting to people who know them, work in their niche, and actively want to hear from them. A creator with 200,000 followers is reaching a much wider, less connected audience, many of whom followed them once and never engaged again. The math simply favors the smaller, tighter network.
Practical takeaway: benchmark against accounts your own size, in your own industry. Comparing a 5,000-connection profile to a mega-creator's rate isn't a fair fight, and it will make a perfectly healthy number look like a failure.
Roughly, here's how the pattern tends to play out across follower tiers in 2026 data:
These are directional patterns, not fixed numbers. The point isn't to hit a specific figure for your tier. It's to stop comparing your account to one in a completely different tier.
LinkedIn Engagement Rate Benchmarks by Industry
Format and follower count aren't the only variables. Your industry sets a baseline too, and it's one of the most commonly overlooked factors when people judge their own performance.
If your rate looks low next to a generic "platform average," check whether that average was pulled from a more naturally high-engagement sector before assuming your content is underperforming.
Engagement Rate vs. Reach and Impressions: What's the Difference?
These three metrics get used interchangeably, but they answer different questions:
- Impressions count how many times your post was displayed, including repeat views from the same person.
- Reach counts how many unique people saw your post, no duplicates.
- Engagement rate measures what percentage of those viewers actually did something once they saw it.
A post can have high impressions and low engagement rate (lots of people scrolled past it) or lower impressions and a high engagement rate (a smaller audience that genuinely cared). Neither number tells the full story alone, which is exactly why tracking engagement rate alongside impressions and reach, rather than any single one in isolation, gives you the clearest read on what's actually working.
Not All Engagements Are Equal
Your engagement rate formula treats a like, a comment, and a repost as identical inputs, but LinkedIn's ranking system doesn't. Comments and reposts generally carry more algorithmic weight than reactions, since they take more effort and signal a stronger response to the content.
That means two posts can post the exact same engagement rate and perform very differently in distribution. A post with 40 comments and 10 reactions is doing more for you than one with 50 reactions and no comments, even though the rate calculation comes out the same. When you're reviewing your numbers, glance at the mix, not just the total.
Why Engagement Rate Matters More Than Vanity Metrics
LinkedIn's ranking system doesn't just count likes. It reads engagement as a signal of quality and uses that signal to decide who else should see your post next, the same mechanism that drives the LinkedIn algorithm as a whole. Posts that earn fast, genuine engagement in the first hour tend to get pushed to a wider audience, which is exactly why engagement rate, not follower count, is the number worth optimizing for.
Practical takeaway: a smaller, more engaged post almost always outperforms a bigger, quieter one over time, because it keeps earning LinkedIn's attention long after it's published.
Common Mistakes That Skew Your Engagement Rate
Before you touch your content strategy, check whether your number is actually telling you the truth. These are the most common ways people misread their own engagement rate:
- Calculating by followers instead of impressions. This is the single biggest source of confusion. It can make your rate look artificially high or low depending on how widely LinkedIn distributed that specific post.
- Comparing against a wildly different account size. A 3,000-connection profile and a 300,000-follower page are not playing the same game. Benchmark against your own tier.
- Averaging across formats instead of segmenting by them. Blending your carousel performance with your text-post performance hides which format is actually carrying your account.
- Treating every engagement as equal. As covered above, a comment-heavy post is doing more than a like-heavy post at the same rate.
- Judging performance from a single post. One unusually viral or unusually quiet post can swing your average for weeks if you're not looking at a rolling trend.
How to Move Your Engagement Rate in the Right Direction
Rather than list every tactic here, let's focus on the moves that connect directly to the rate itself, the number you just learned to calculate:
- Lean into native documents and carousels. As the benchmark data above shows, this format consistently posts the highest engagement rate on the platform. If your rate is stuck below your industry average, well-built LinkedIn carousel posts are usually the fastest way to move it before you touch anything else.
- Track your rate weekly, not your raw like count. A LinkedIn analytics tool that surfaces engagement rate alongside impressions makes it obvious when a format or topic shift is actually moving the needle versus just generating noise.
- Set your baseline before you chase a benchmark. Pull your last 10 to 15 posts, calculate the rate for each using the formula above, and average them. That number, not an industry-wide figure, is what every future post should be measured against.
- Go tactical once your baseline is set. Hooks, comment strategy, posting cadence, and timing all move engagement rate, and the 15 tactics covered in how to increase engagement on LinkedIn go deep on all four.
Conclusion
Your LinkedIn engagement rate tells you more about your content strategy than any single vanity metric. It's the number that shows whether your audience is actually paying attention, not just present. Calculate yours, compare it to your own history rather than a single benchmark, and use the moves above to nudge it upward one post at a time. If you'd rather not track all of this by hand, Draftly helps you write, schedule, and analyze your LinkedIn content in one place, so you can see what's driving engagement without living in a spreadsheet.