Quick test: pull up your last 10 LinkedIn posts. Could you say, right now, which one actually drove profile visits or inbound messages? Most people can't. They can tell you which post "felt" like it did well because the like count looked good, but that's not the same thing.
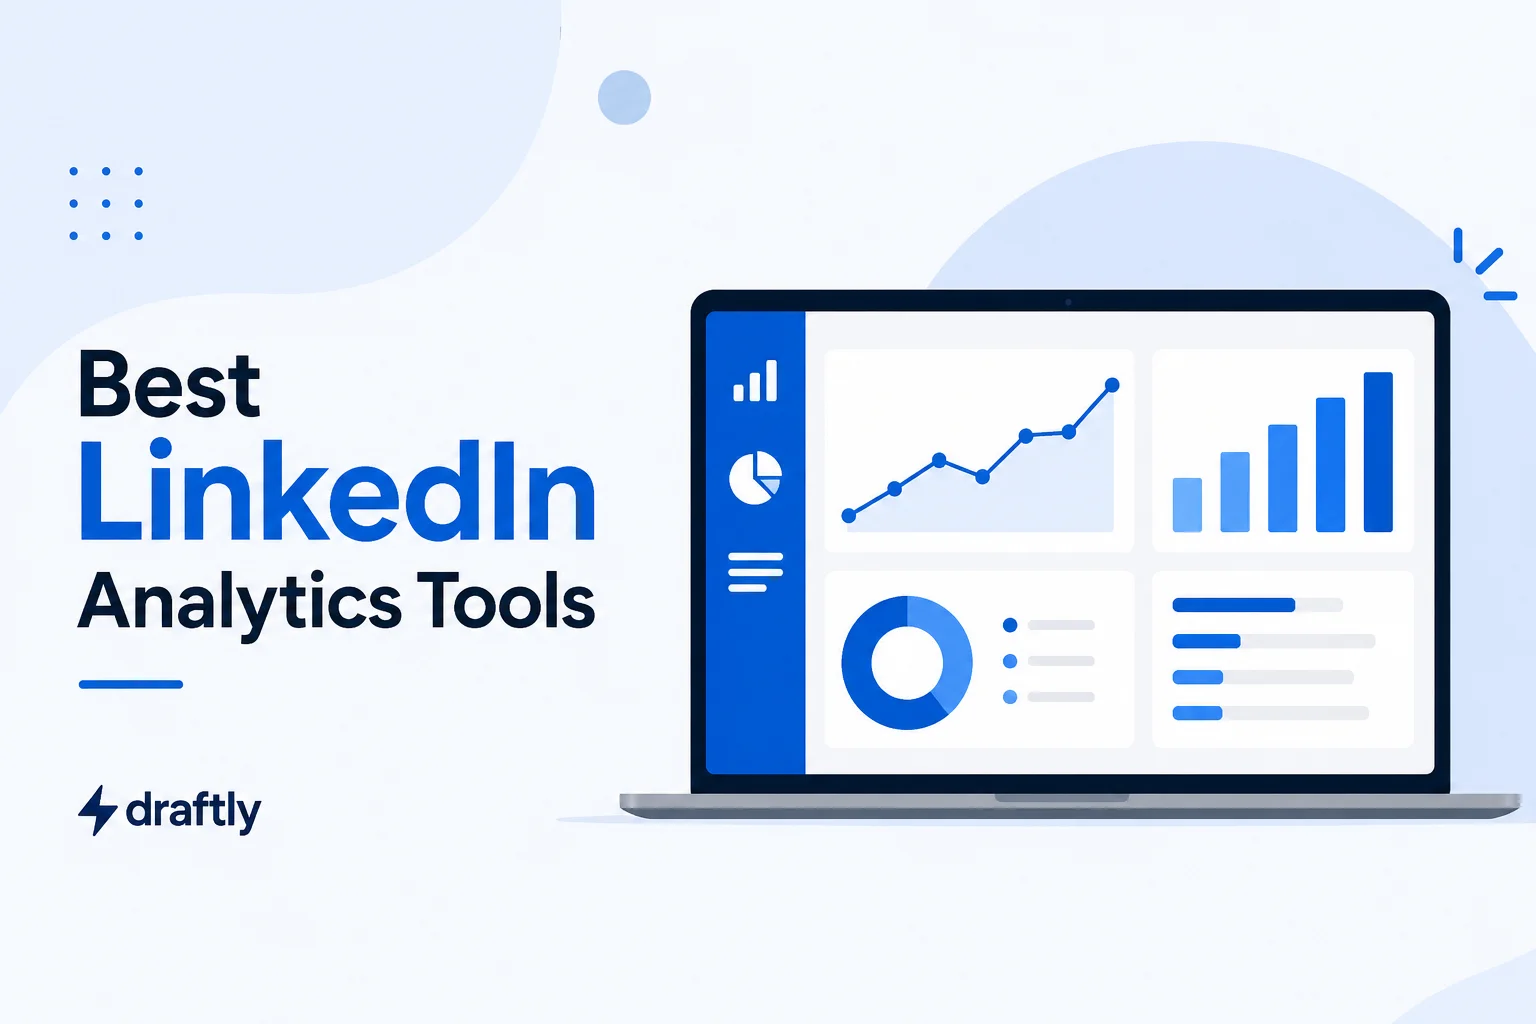
That gap between "felt good" and "actually worked" is the whole reason LinkedIn analytics tools exist. LinkedIn's own dashboard gives you the raw numbers, but it doesn't do much to connect those numbers to what you should post next. A dedicated tool closes that loop.
Below is a rundown of the best LinkedIn analytics tools for 2026, what each one is useful for, and a simple way to figure out which one is worth paying for versus which is overkill for where you're at.
The 7 tools at a glance:
- Draftly: best if you want scheduling and post engagement tracking in the same app
- LinkedIn's Native Analytics: best if you're posting casually and don't need to pay for anything yet
- AuthoredUp: best for individuals who want formatting and post-level analytics together
- Taplio: best for solo creators who want content ideas and tracking in one place
- Hootsuite: best if LinkedIn is one of several channels you're managing
- Sprout Social: best for teams that need to hand off polished, recurring reports
- Social Champ: best for small businesses on a tight budget
Why You Should Track Your LinkedIn Analytics in the First Place
If you're posting once or twice a month, you can skip most of this. The math only starts mattering once you're posting consistently enough that patterns actually show up.
Here's what changes once you start paying attention to the numbers:
- You stop guessing and start repeating what works. Most people keep posting the same format because it's comfortable, not because it's performing. Data tells you which is true.
- You can actually justify the time spent. If you're posting for a company, "engagement felt good this month" won't survive a budget conversation. A follower growth chart will.
- You catch drop-offs early. A slow decline in reach is easy to miss week to week. Look at three months side by side and it jumps out immediately.
- You separate reach from relevance. A post can rack up impressions from people who'll never buy anything from you. Good analytics tools show you who's actually engaging, not just how many eyeballs passed by.
None of this happens in isolation either. Tracking performance is really just one piece of a broader B2B marketing strategy on LinkedIn, where your content, your page setup, and any paid campaigns are all feeding the same set of numbers.
The LinkedIn Metrics Worth Paying Attention To
Before picking a tool, it helps to know what you're looking for. Most people default to checking likes, which is close to useless on its own. A few things worth tracking instead:
Engagement rate, not raw engagement. A post with 40 reactions on 2,000 impressions is doing better than one with 100 reactions on 15,000 impressions. Divide total engagements by impressions to get the rate, and compare that number across posts rather than comparing raw totals. Here's how to calculate your LinkedIn engagement rate step by step if you want the full formula.
Profile views after a post goes out. This is the metric most people skip, and it's often the most telling one. If a post gets great reach but doesn't move your profile view count, it's entertaining people, not converting them into anything.
Follower quality over follower count. LinkedIn's native dashboard breaks followers down by job title, seniority, and industry. If you're posting for B2B leads and half your new followers are students or unrelated roles, your content is attracting the wrong audience even if the growth chart looks nice.
Keep these three in mind as you read through the tools below. The right tool is the one that makes tracking these easy, not the one with the flashiest dashboard. And if you want to know why some posts travel further than others in the first place, our breakdown of how the LinkedIn algorithm ranks posts explains the signals behind these numbers.
Do You Need Anything Beyond LinkedIn's Native Analytics?
Before spending money on anything, it's worth knowing what's already sitting in your account for free. Both personal profiles and company pages come with a built-in analytics tab showing:
- Post-level impressions, reactions, comments, and shares
- Follower growth and demographics (job title, industry, seniority, location)
- Profile view counts over time
- Company page visitor and engagement trends
If you haven't gone through the process yet, this is the dashboard you'll land in once you set up a LinkedIn business page, so it's worth getting familiar with before adding anything else on top.
For occasional posting, native analytics are enough. Where it falls apart is comparing performance across months, benchmarking against competitors, or pulling something presentable for a client. That's the actual gap third-party tools are built to fill.
The Best LinkedIn Analytics Tools for 2026
Quick heads up before the list: if you've seen Shield Analytics recommended elsewhere, it shut down in May 2026. LinkedIn and Google made its cookie-based browser extension impossible to keep running, and the founders closed it rather than fight that. If you're a former Shield user, you'll want a real replacement, not just a mental note to "check LinkedIn's native dashboard instead."
That shutdown is part of a bigger shift. LinkedIn opened an official analytics API to approved partners in mid-2025, and tools that don't use it (the ones still scraping your session in the background) are increasingly a risk to your account. Every tool below either uses LinkedIn's official API or reads only publicly available data.
1. Draftly
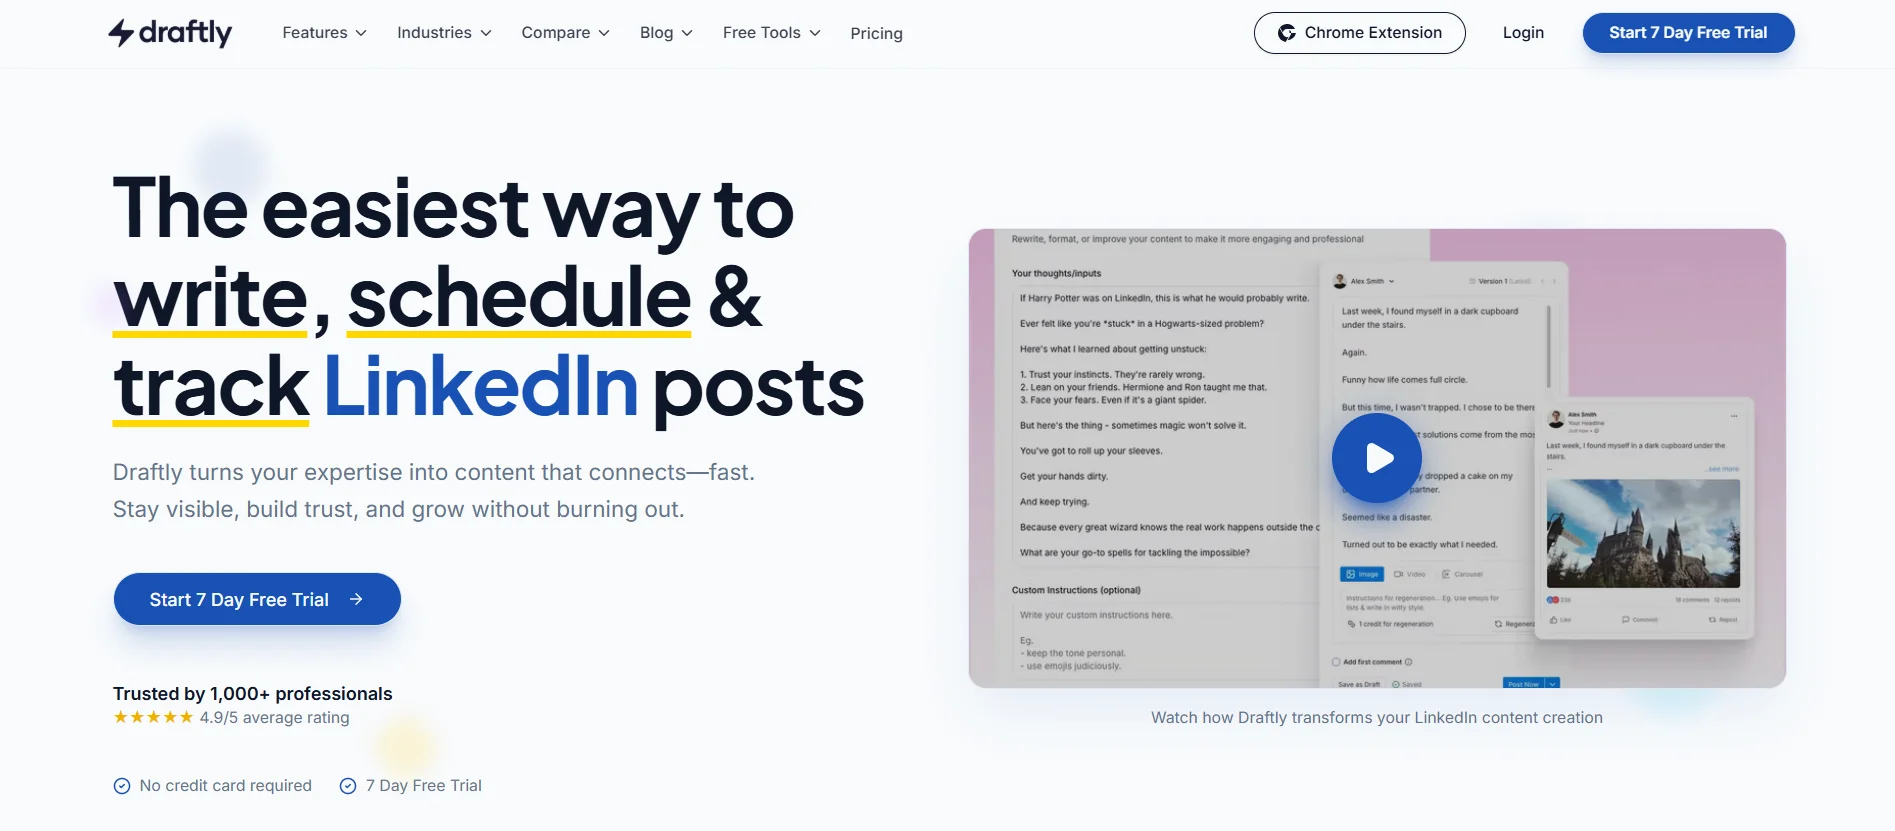
Draftly brings content creation, scheduling, and analytics together in one place, so you're not stitching together three different subscriptions just to find out whether your LinkedIn posts are landing. Write a post, schedule it, and its engagement shows up in the same app.
Key features:
- Tracks likes, comments, and reposts on your published posts, with analytics refreshed weekly so you can see which topics and formats land
- Scheduling, the content calendar, and post analytics sit side by side, so there's no second tool to manage just for reporting
- Analytics are part of every plan, alongside the rest of Draftly's writing, scheduling and analytics features
Pricing: a free plan with five posts and carousels a month and no card required. Starter is $19 a month and Pro is $49 a month, or $190 and $490 a year on annual billing (current Draftly plans).
Good fit if: you want to see which of your posts earn likes, comments, and reposts without opening a separate analytics tool. For impressions, profile views, and follower demographics, LinkedIn's own dashboard is still the place to look.
2. LinkedIn's Native Company Page Analytics
Sometimes the answer really is "you already have this." If your needs are simple, one page, occasional posting, no need for month-over-month comparisons, the built-in dashboard covers it without a subscription.
Key features:
- Post-level impressions, reactions, comments, and shares
- Follower growth and demographics (job title, industry, seniority, location)
- Profile view counts and company page visitor trends
Pricing: Free, built into every LinkedIn profile and company page.
Good fit if: you're posting occasionally and haven't maxed out what's already free. Try native analytics for a month or two before adding anything else on top.
3. AuthoredUp
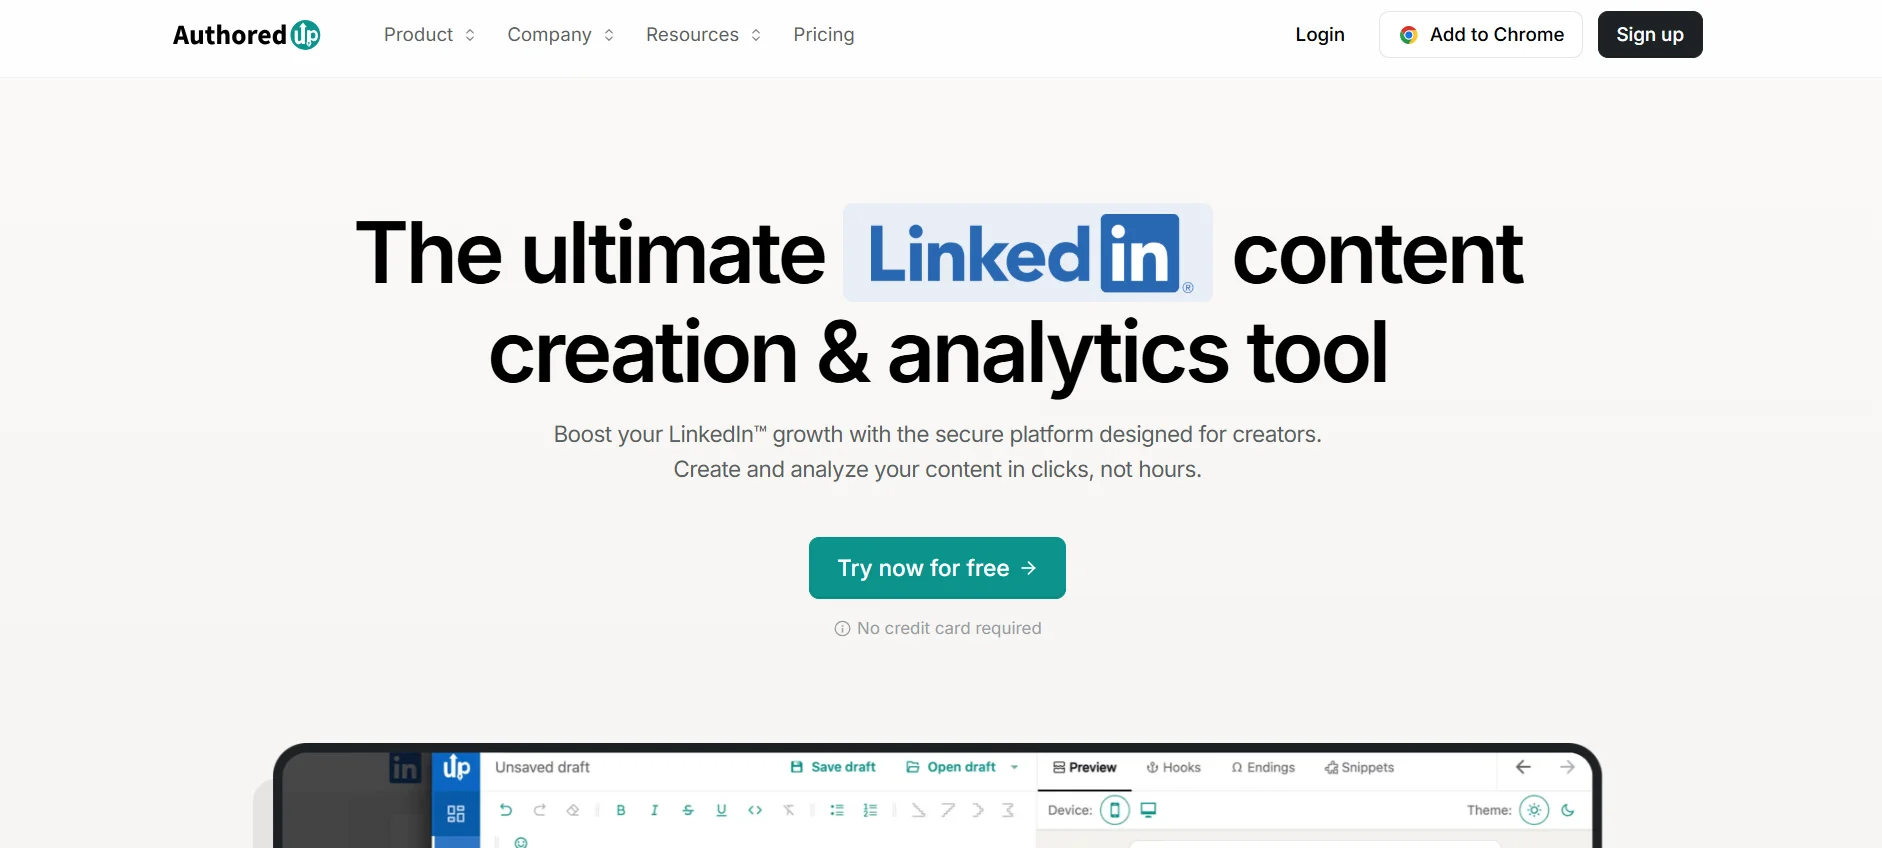
AuthoredUp started as a LinkedIn formatting tool (it fixes the bold, bullets, and spacing that LinkedIn's native editor makes annoying to do), but its analytics have become the reason people stick around after the formatting novelty wears off.
Key features:
- Tracks post-level impressions, engagement rate, and profile views
- Side-by-side post comparison to see what's actually driving results
- Runs as a Chrome extension directly inside LinkedIn's composer, no separate dashboard
Pricing: $19.95/month for a single profile, or $14.95/month per profile on the Business plan (minimum three profiles), with a 14-day free plan.
Good fit if: you post consistently as an individual and want your formatting tool and your analytics to be the same subscription.
4. Taplio
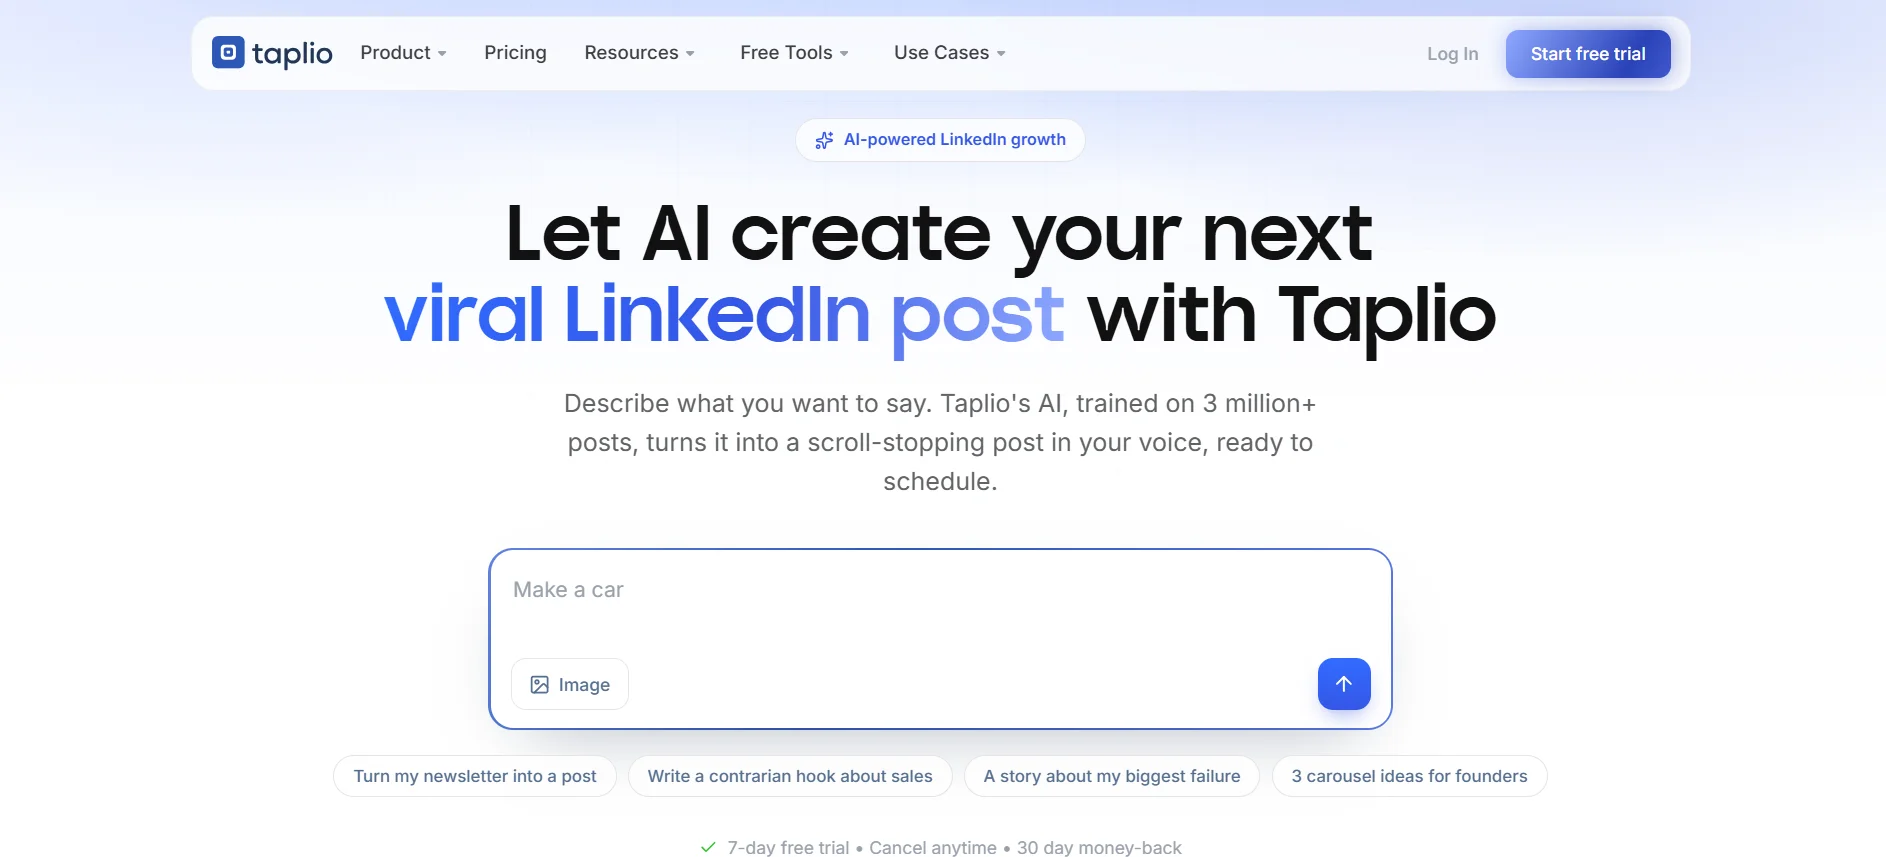
Taplio pairs content planning with performance tracking, so idea generation and analytics live in the same subscription. You draft, schedule, and then see the results without switching context.
Key features:
- Tracks post performance, follower growth, and engagement over time
- Shows which topics and formats are working for your specific audience
- Viral post library for content inspiration, bundled with the analytics
Pricing: Starts at $39/month for the Starter plan (scheduling, a viral post library, and basic analytics), with higher tiers adding AI content credits and team features up to around $199/month. There's a 7-day free plan with full access.
Good fit if: you'd otherwise be juggling a separate writing tool and a separate analytics tool. Consolidating both cuts down on the number of places you have to check, though the analytics themselves are closer to LinkedIn's native depth than a dedicated analytics platform.
5. Hootsuite Analytics
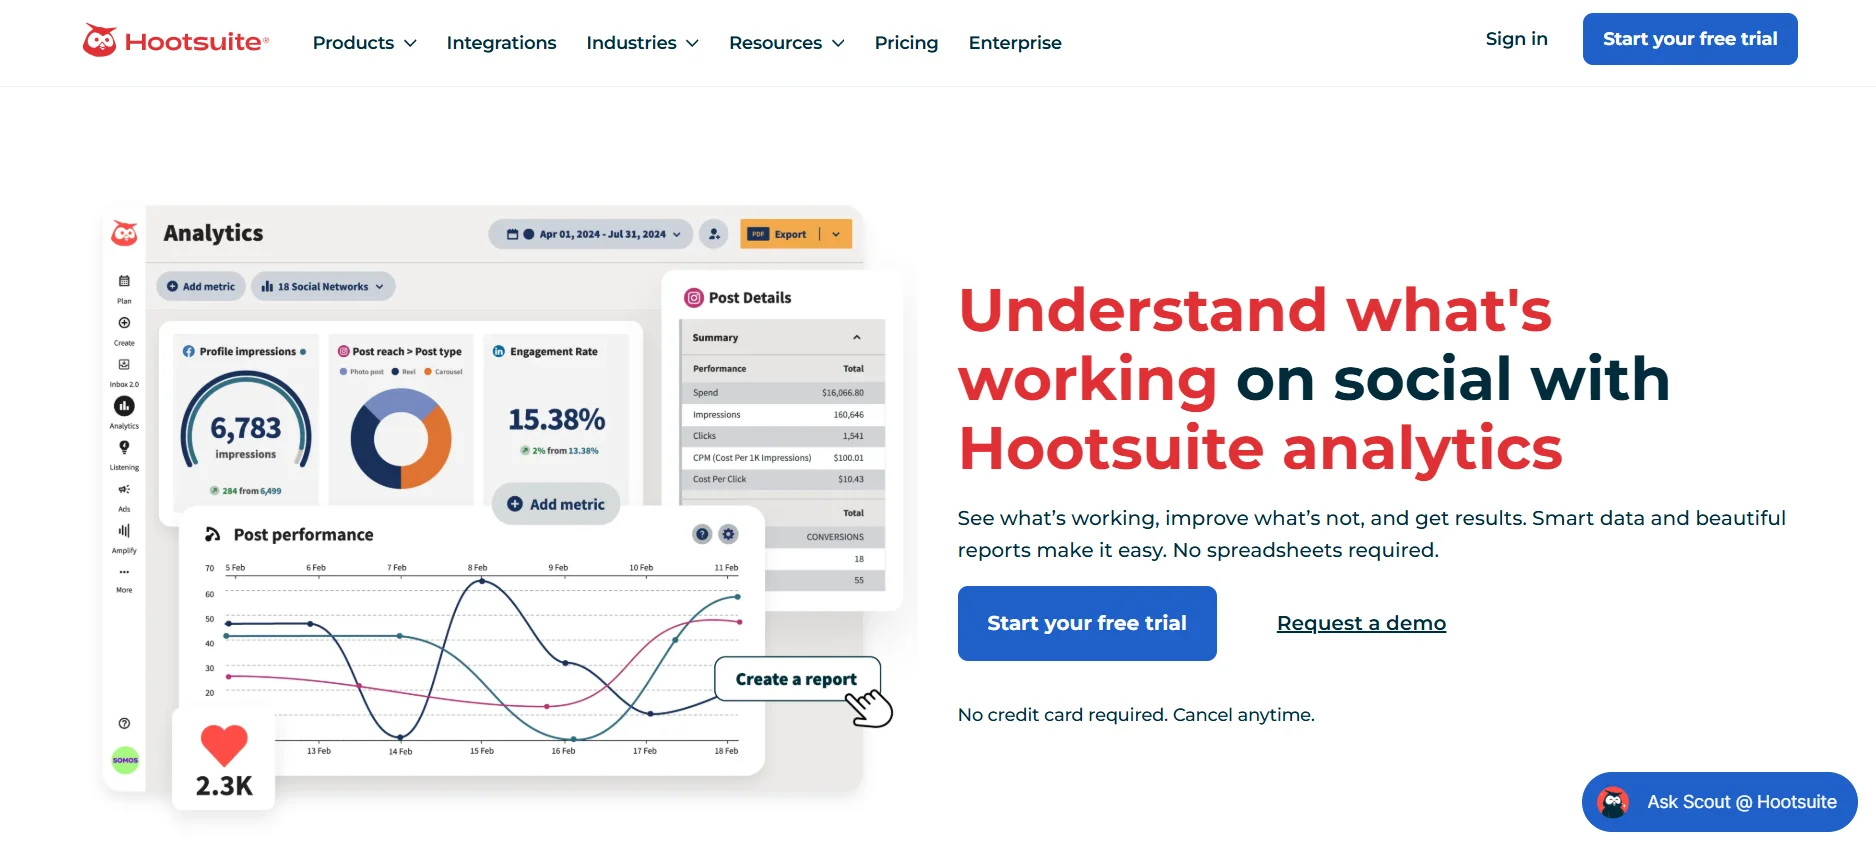
Hootsuite treats LinkedIn as one channel among several rather than the main event. If your team is also managing Instagram, X, or Facebook, Hootsuite rolls all of it into a single cross-channel report instead of forcing you to check each platform separately.
Key features:
- Personal profile analytics alongside company page reporting (added mid-2025)
- Cross-channel reports covering LinkedIn plus other social networks in one view
- Official LinkedIn Marketing Partner, using LinkedIn's authorized API
Pricing: Starts around $99/month for the Professional plan, with a 30-day free plan, one of the longer trials on this list.
Good fit if: LinkedIn is part of a bigger social strategy, not the whole strategy. The $99/month starting price reflects that broader scope rather than a LinkedIn-specific tool.
6. Sprout Social
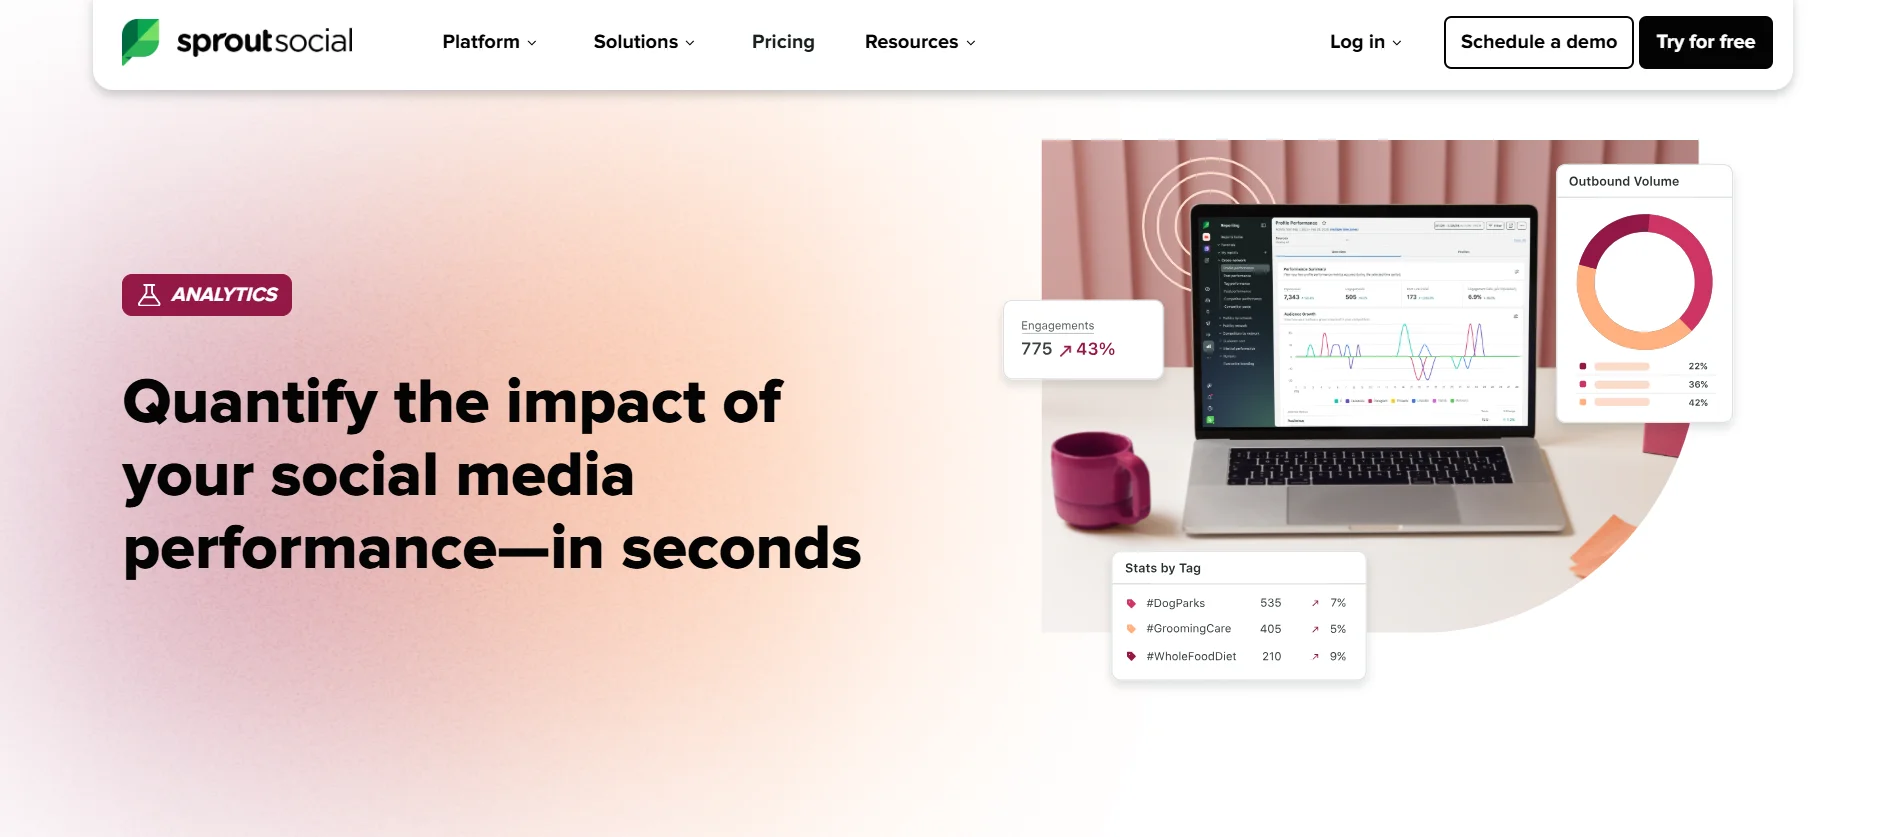
Sprout Social is built for teams that need to hand off polished reports regularly, whether that's to a manager, a client, or leadership.
Key features:
- Smart Inbox consolidates messages, comments, and mentions across accounts
- Engagement, audience demographics, and competitor benchmarking on higher tiers
- Separates paid and organic performance in the same view
Pricing: Starts at $199 per seat per month on the Standard plan (billed annually), covering up to 5 social profiles and basic analytics. Competitor reports and deeper analytics require the Professional tier and up.
Good fit if: you need to hand off reports regularly and benchmarking against competitors matters, or you're running paid campaigns alongside organic posting and want both in the same view instead of comparing two separate exports.
7. Social Champ
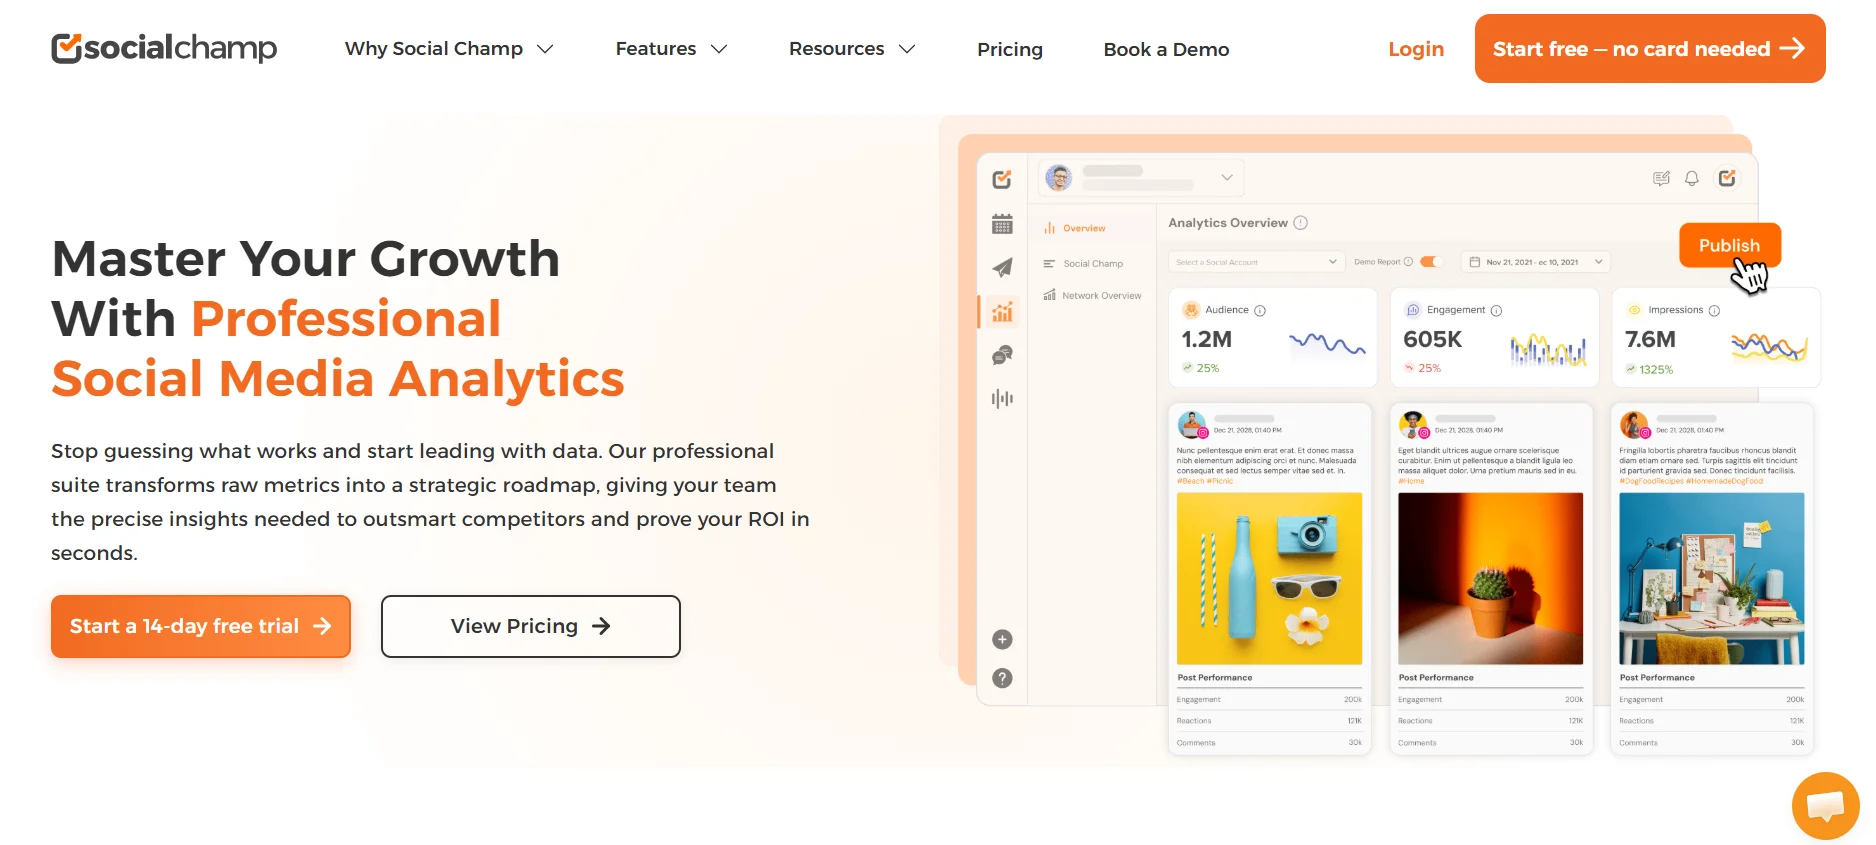
Social Champ leans toward small businesses and solo marketers who want scheduling and reporting without enterprise pricing attached.
Key features:
- A usable free plan: 3 social accounts, 15 scheduled posts per profile, 2 weeks of analytics history
- Covers engagement, reach, and growth trends across LinkedIn and other platforms
- Stops short of some LinkedIn-specific detail, like follower breakdowns by job function or company size, that LinkedIn's own dashboard already provides for free
Pricing: Free plan available. Paid plans scale per channel, around $4 to $9/month, rather than charging per seat.
Good fit if: you're a small business on a tight budget and don't need Sprout- or Hootsuite-level depth. It's a reasonable trade given the price difference, just don't expect it to fully replace native analytics rather than supplement them.
How to Choose the Right LinkedIn Analytics Tool for You
Skip the feature comparison chart for a second. Start with these instead:
- Name what you're actually trying to learn. Personal brand growth is a different question than "did this campaign generate leads." If you're still early in building a B2B brand on LinkedIn, you probably don't need heavy reporting yet. Start simple and add tools as your posting volume grows, not before.
- Check whether it separates personal profiles from company pages. Some tools are clearly built for one and feel bolted onto the other.
- Look for trends over time, not a single snapshot. One day's numbers tell you almost nothing on their own.
- Confirm you can actually export something. If you need to report to anyone else, a screenshot of a dashboard doesn't cut it. Make sure a clean PDF or spreadsheet is an option.
- Test it against real posts before paying. Most tools on this list offer a free plan or trial. Run it against two or three weeks of actual posting before committing to a plan.
The right tool isn't the one with the most charts. It's the one that answers the specific question you keep asking yourself after hitting publish.
Conclusion
The best LinkedIn analytics tool isn't the one with the longest feature list. It's the one that answers the question you actually have, whether that's "is my personal brand growing" or "are these posts turning into pipeline." Start with what's already built into LinkedIn, learn your baseline engagement rate and profile view trend, and only add a paid tool once you need history, comparisons, or reports you can hand to someone else.
Want your scheduling and your post engagement in one place? Start Draftly's free plan and schedule five posts a month, no card needed.