Scroll through LinkedIn for five minutes and count how many times you stop on a text post versus a video. If you're being honest, video probably wins that race without much of a fight. There's something about a moving thumbnail or a face talking directly to the camera that just grabs your thumb and stops the scroll.
This isn't just a gut feeling. If you've ever dug into your LinkedIn analytics dashboard, you've probably noticed video posts pulling in numbers that text and image posts simply can't match. Higher watch time, more comments, better reach. It's not magic. It's how the platform is built and how people actually behave when they're scrolling.
Let's break down why this happens and what you can actually do about it.
What LinkedIn Analytics Actually Tell You
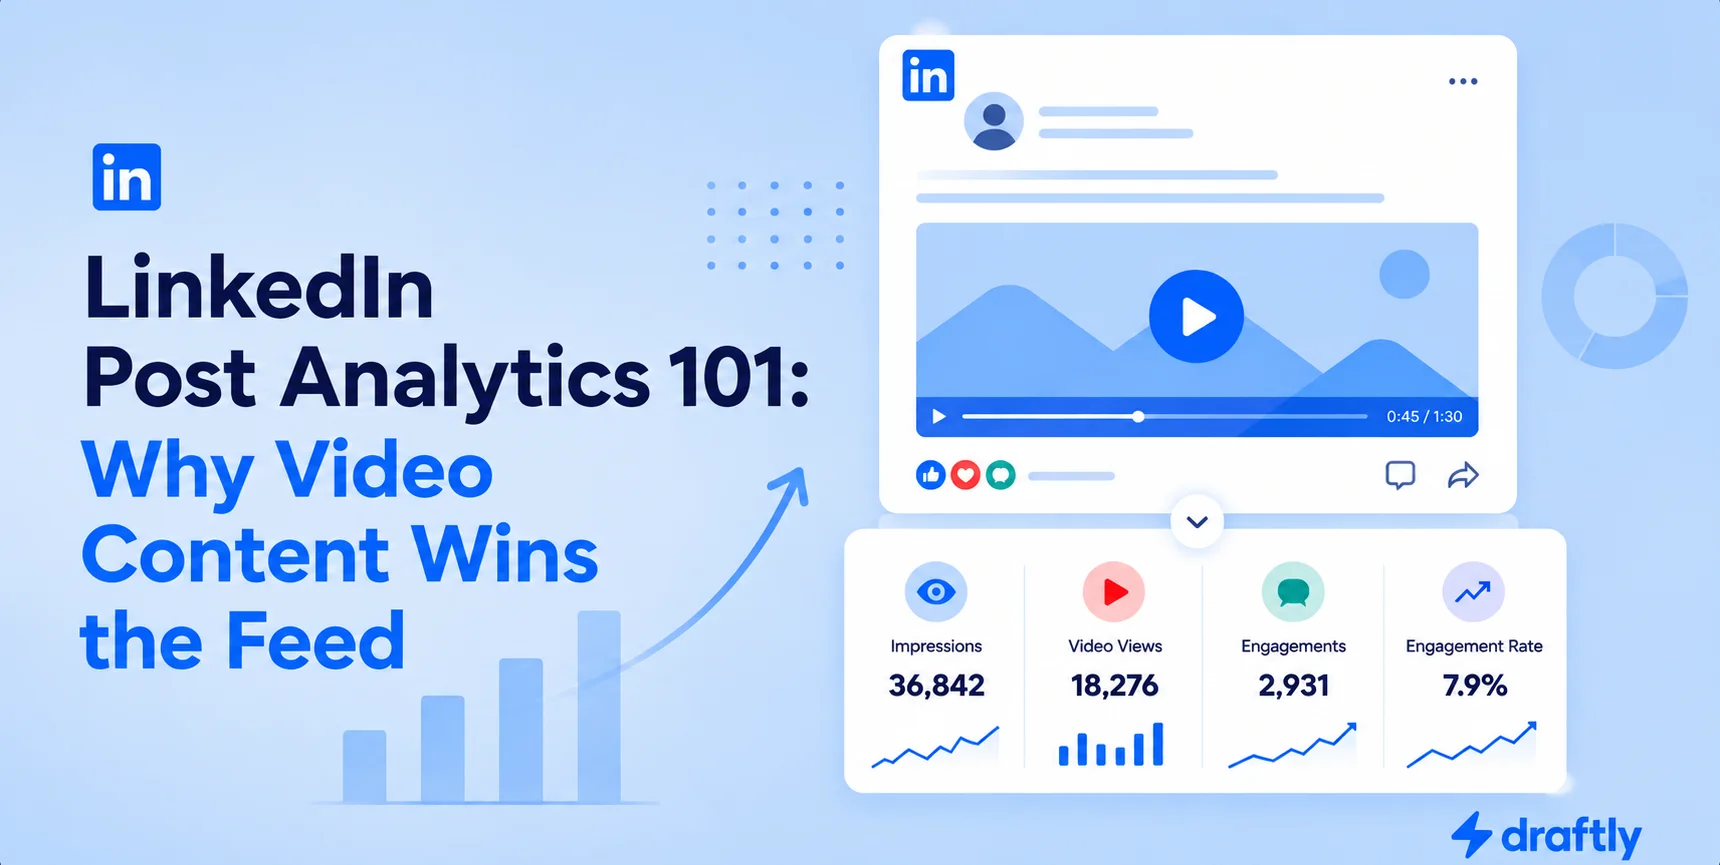
Before we get into video specifically, it helps to understand what LinkedIn is measuring in the first place. When you open the analytics tab on any post, you're looking at a handful of core numbers:
- Impressions – how many times your post showed up on someone's screen
- Engagement rate – likes, comments, shares, and clicks divided by impressions
- Unique views – how many distinct people actually saw it
- Watch time (for video specifically) – how long people stuck around before scrolling past
Most creators obsess over likes because they're the easiest number to see. But if you want to understand why your content is or isn't performing, watch time and engagement rate matter a lot more. A post with 50 likes and thousands of impressions is doing something very different than a post with 50 likes and only 300 impressions.
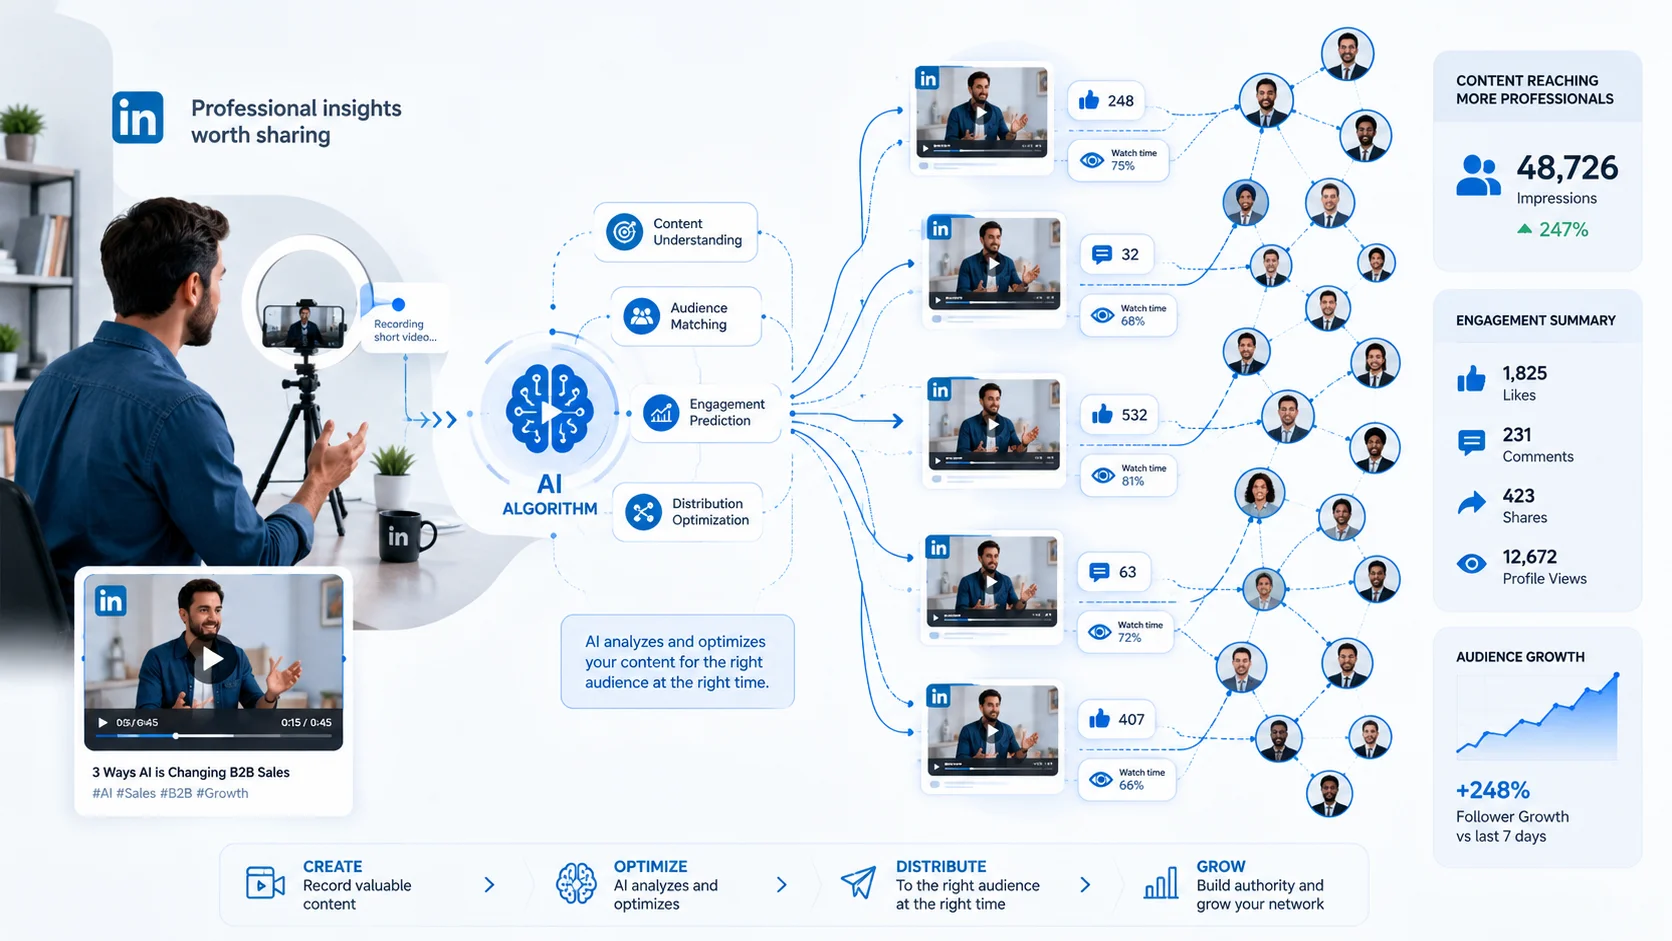
Here's the part that surprises a lot of people. LinkedIn's algorithm doesn't just show your post to your followers and call it a day. It tests the post with a small group first. If that group engages quickly, meaning they comment, share, or watch through most of a video, LinkedIn pushes it further. If people scroll right past, the post quietly dies in the feed.
This is exactly why video has such an advantage. It gives the algorithm more signals to work with, faster.
Why Video Content Consistently Outperforms
People Process Video Faster Than Text
Think about how you actually consume LinkedIn. When you see a wall of text, your brain has to decide whether it's worth the effort to read. That decision alone costs you a second or two, and on a feed full of competing content, that hesitation often ends with a scroll away.
A video doesn't ask for that same commitment upfront. It starts playing. You get a taste of what it's about within the first two or three seconds, and your brain decides almost instantly whether to keep watching. That instant hook is something plain text just can't replicate.
Autoplay Changes the Game
LinkedIn autoplays videos as they enter the viewport. This means your video is already working before the viewer has decided to engage. Compare that to a text post, which requires someone to actively read the first line before deciding to click "see more."
This single feature is probably the biggest reason video numbers look so different, and it's one of the simplest levers for boosting your impressions without changing anything else about your strategy.
Watch Time Signals Quality to the Algorithm
When someone watches 15 seconds of your 30 second video, that's a strong signal. LinkedIn interprets that as "this content is worth showing to more people." Compare this to a like, which takes half a second and doesn't really tell the algorithm much about whether the content was actually valuable.
This is why creators who post video consistently tend to build reach faster than those who rely purely on text, even when the text posts are well written.
Video Builds Trust Faster
There's also a human element here that analytics dashboards don't always capture directly, though it shows up in the numbers eventually. Seeing someone's face, hearing their voice, watching how they explain something builds a kind of trust that a paragraph of text struggles to create. People remember faces. They remember the tone of voice, and over time that's a big part of building a recognizable personal brand. This translates into more profile visits, more connection requests, and more comments that actually go somewhere.
The Metrics That Actually Matter for Video
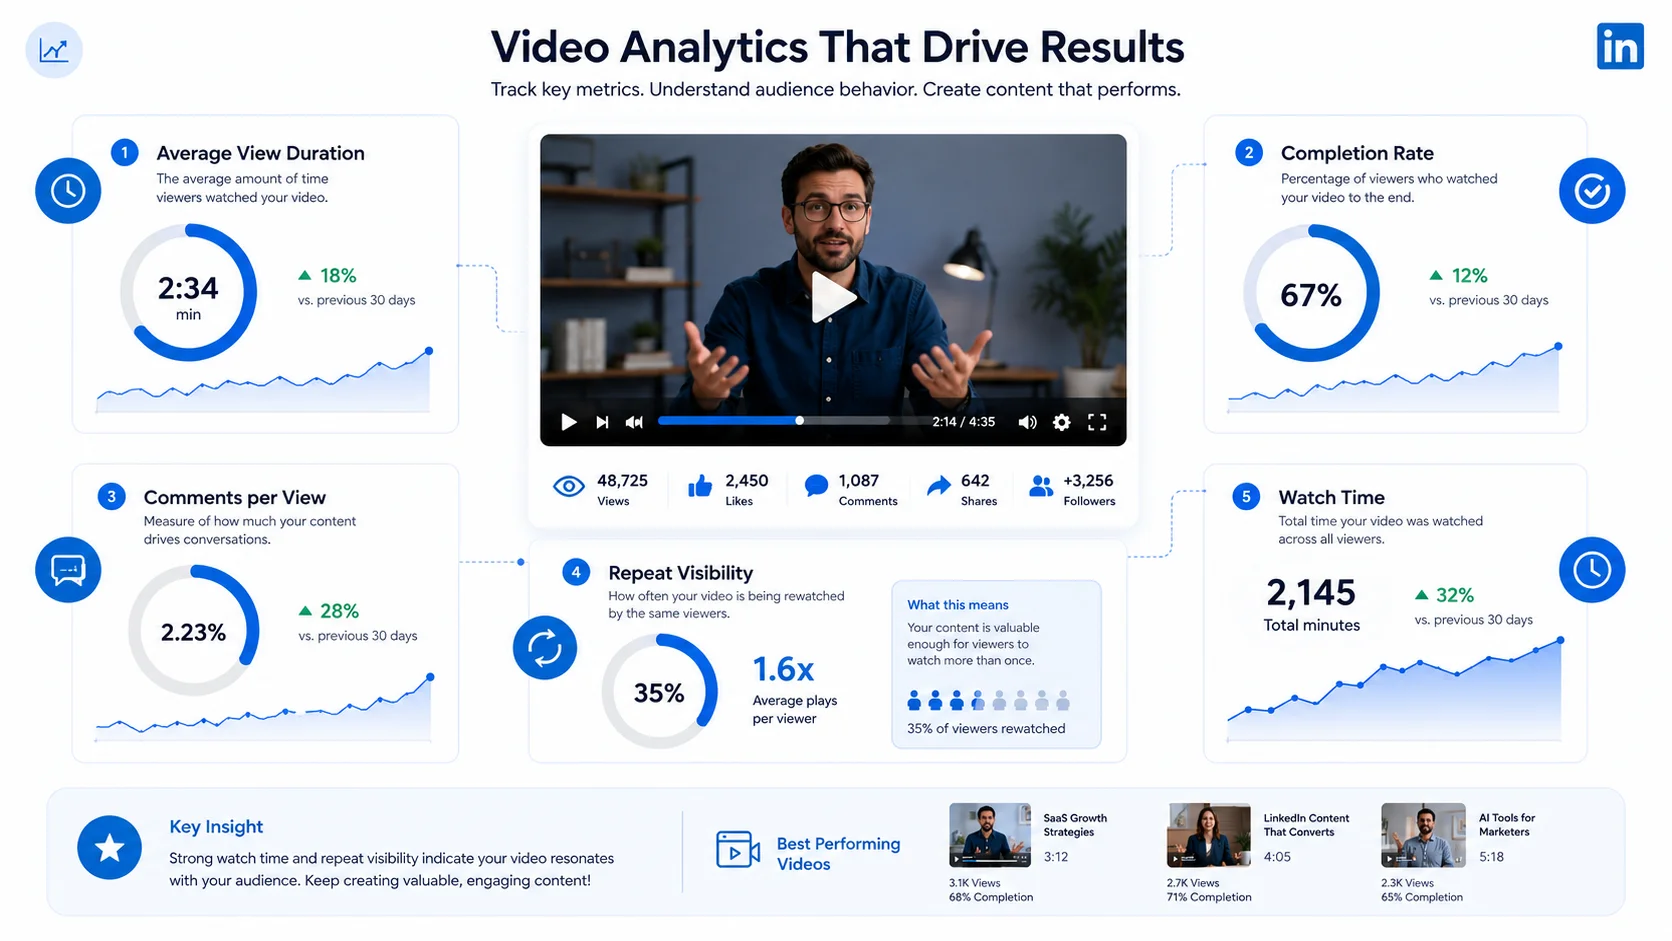
If you're going to lean into video content, don't just track views. Views are the vanity metric everyone likes to quote, but they don't tell the full story. Pay closer attention to these instead:
- Average view duration – are people watching 5 seconds or 50?
- Completion rate – what percentage actually watch to the end?
- Comments per view – this tells you if the content sparked conversation, not just consumption
- Repeat visibility – is the same post still showing up in your analytics days after you posted it?
A video that gets 2,000 views but only 8% of people watch past the first five seconds is telling you something important. Your hook isn't working. On the flip side, a video with fewer total views but a completion rate above 50% is a sign that the content itself is genuinely resonating, and LinkedIn will likely keep pushing it.
Making Video Content Without It Becoming a Full Time Job
Here's where a lot of people get stuck. They know video performs better, but the idea of learning editing software, dealing with export formats, and fighting with clunky timelines feels like more trouble than it's worth. This is usually where good intentions quietly die.
The good news is that you don't need a production studio to make this work. Most of the videos that perform well on LinkedIn are simple. A talking head clip, a quick screen recording, a short behind the scenes moment. What actually matters is that the video is trimmed well, has clear captions since a lot of people watch with sound off, and doesn't drag on longer than it needs to.
This is where a tool like Clideo comes in handy for people who aren't video editors by trade. It lets you trim, resize, and add subtitles to your clips right in the browser, without installing anything heavy or learning a new piece of software from scratch. For someone posting content regularly and trying to keep a consistent LinkedIn presence, that kind of simplicity matters more than having access to advanced editing features you'll never actually touch.
The point isn't to make cinema quality videos. The point is to remove enough friction that you actually post video instead of talking yourself out of it because editing feels like a hassle.
Common Mistakes That Kill Video Performance
Even with all this potential, plenty of video posts still flop. Usually it comes down to a few avoidable mistakes.
Starting too slow. If your first three seconds are a slow zoom into your face with no context, people scroll. Get to the point immediately.
Ignoring captions. A huge chunk of LinkedIn traffic happens during work hours, which means people are scrolling with their phones on silent. If your video needs sound to make sense, you're losing a big portion of your potential audience before they even give it a chance.
Posting without a caption that adds context. The video shouldn't have to do all the work alone. A short, well written caption above the video gives people a reason to click play, and pairing it with the right hashtags helps it reach people outside your immediate network.
Making it too long. Attention spans on a professional feed are short. If your video runs past 90 seconds without a strong reason, you're likely watching your completion rate drop with every extra minute.
Not testing different formats. Square videos, vertical clips, and horizontal recordings all perform differently depending on device and audience. It's worth experimenting, and checking how it'll actually look before you hit post catches sizing issues early.
Building a Simple Video Routine
If you want video to become a real part of your LinkedIn strategy rather than a one off experiment, consistency matters more than perfection. A few habits that tend to work well:
- Record short clips in batches so you're not scrambling for content every week
- Keep a rough script or bullet points so you don't ramble
- Trim the fat before posting so every video starts with your strongest point
- Add captions every single time, no exceptions
- Check your analytics a few days after posting, not just in the first hour
Over a month or two, patterns will start to show up. You'll notice certain topics get better completion rates. You'll see which video lengths work best for your audience. That data becomes far more useful than guessing.
Wrapping It Up
LinkedIn's algorithm rewards content that keeps people engaged for longer, and video simply does that better than most other formats right now. Autoplay, faster processing time, and stronger trust building all stack together to give video a real edge in the feed.
That doesn't mean text posts are dead or that you need to throw out everything you're already doing. It means video deserves a real spot in your content mix, and getting started doesn't require expensive equipment or a steep learning curve. A clear message, a decent hook, clean captions, and a bit of editing polish will take you a long way.
Check your own analytics this week. Compare your last few video posts against your text posts side by side. Chances are the gap will convince you faster than any article ever could.